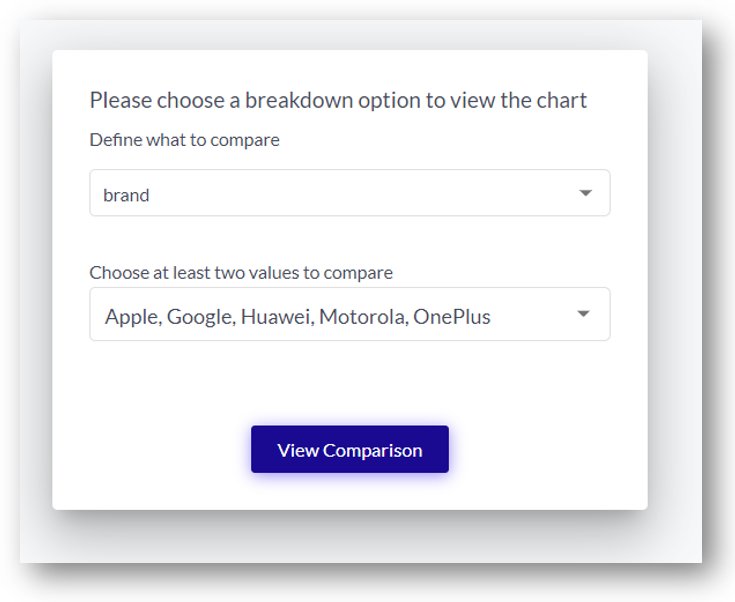
How to set up the chart?
- Select the breakdown option you want to compare, e.g. brand, product, etc.
- Select at least two values to define the subsets of data you want to compare against
- Once you have selected the values, click "View Comparison"
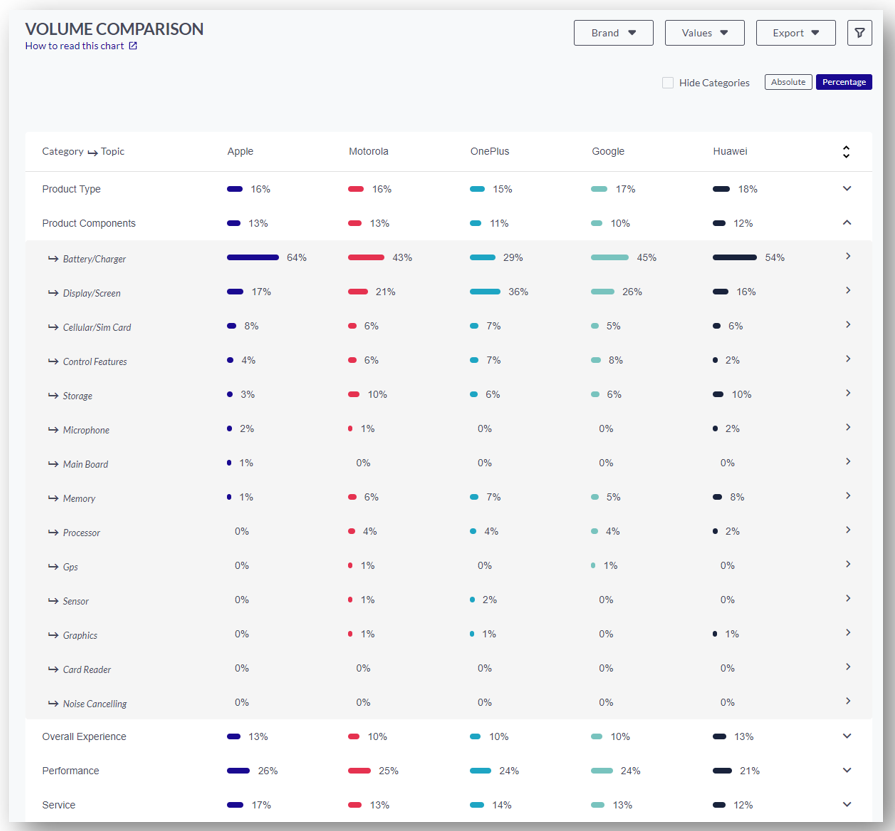
How to read the chart?
Once you have selected values to compare, you will see a table showing the categories and topics broken down by your selected value.
In the following example, you can see the categories and topics split by the selected value, here brands.
This provides direct insights on the different importance of each topic for different segments (brand/product etc.)
You can also click on a topic, which will open the sidebar with more detailed information. It is pre-filtered with the selected topic and meta field.
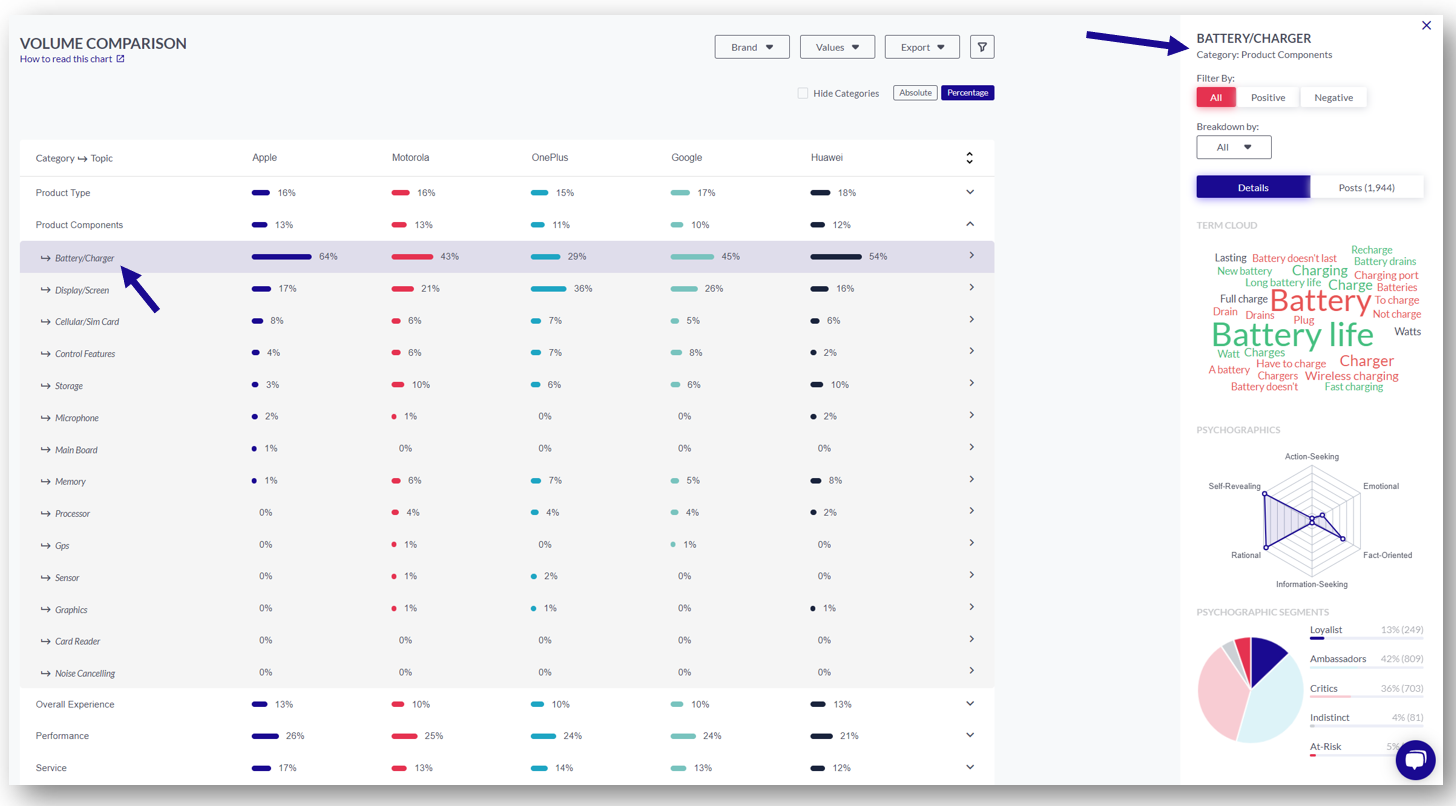
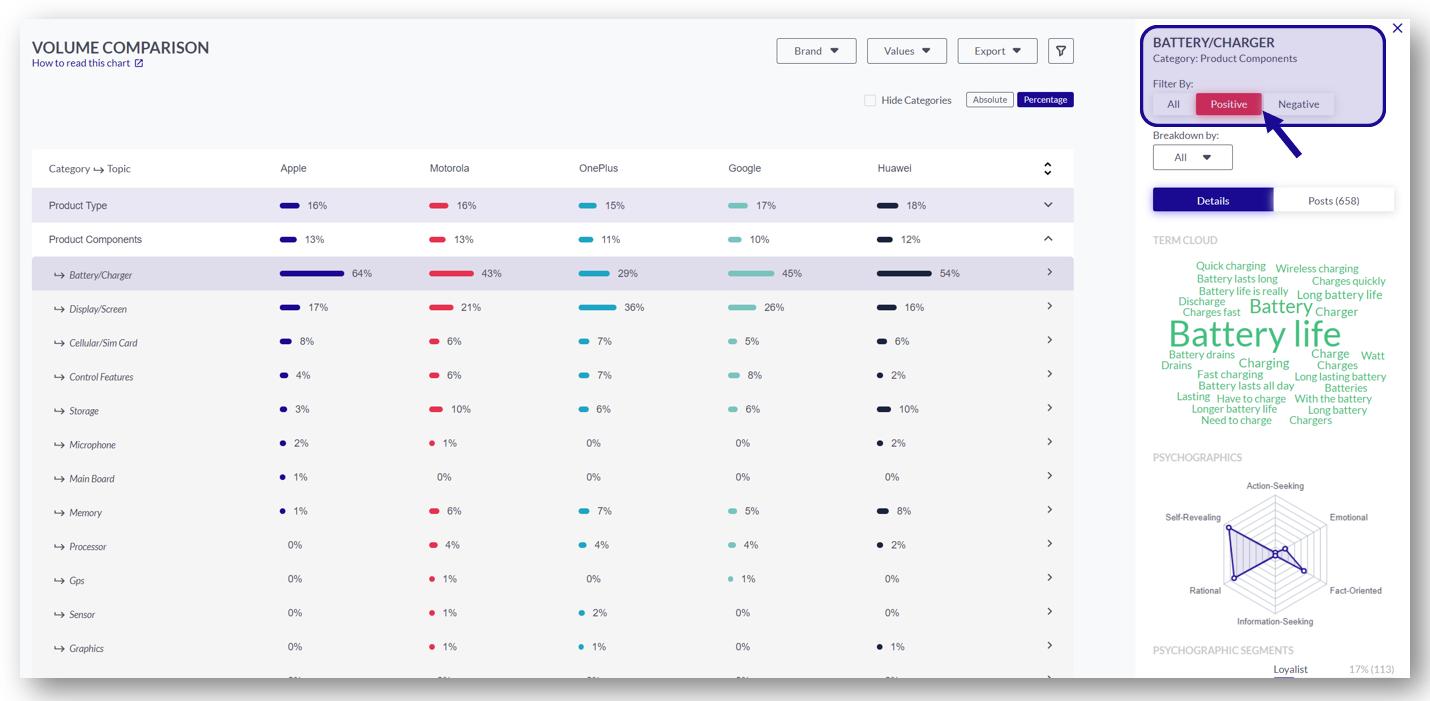
Competitive Insights using sentiment filter
When selecting a specific topic in the table view on the right-hand side a sidebar will open.
There you have the possibility to apply a sentiment filter which then shows you Term Cloud, Sentiment Terms, and Psychographics as well as the posts. This can be used to detect the relative strength/weakness of a specific product/source/brand towards another.
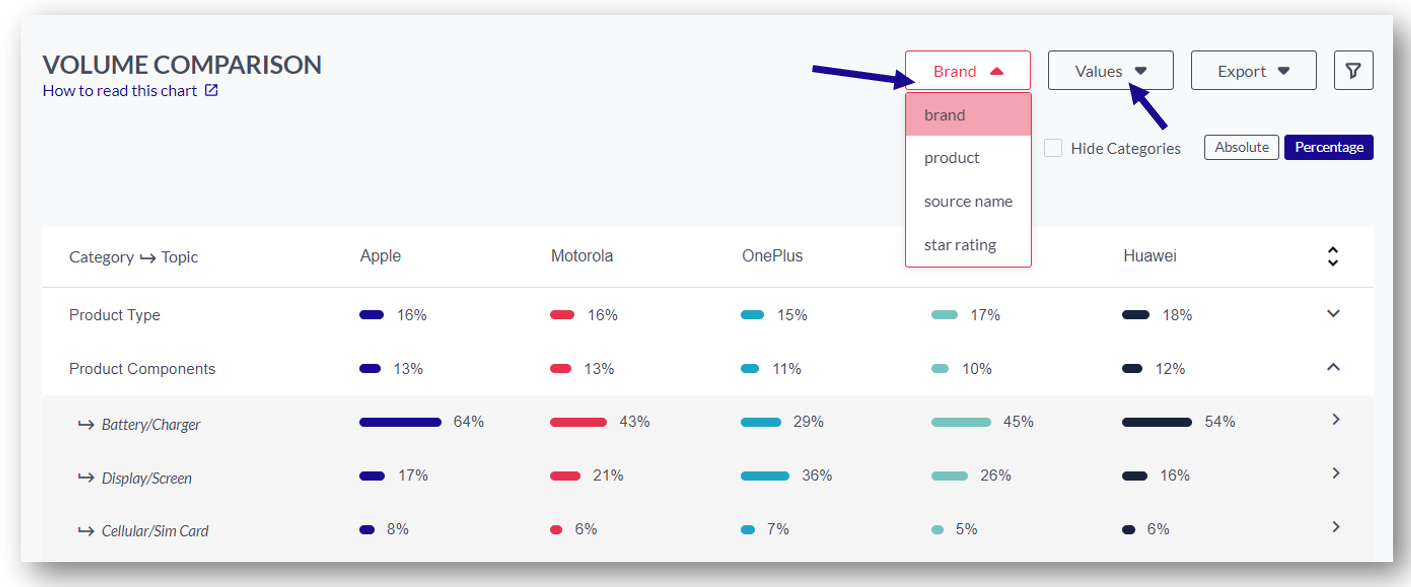
How can I change the setting for the Volume Comparison chart?
You can select a different meta field (here: brand, product, source name, star rating) or different meta field values from the drop-downs above the chart.