How to use Ekman Emotions
1. What are Ekman Emotions?
2. How to use Ekman Emotions?
1. What are Ekman Emotions?
Similar to sentiment analysis, emotion analysis is another feature of Symanto AI text analytics that detects beyond topics. It helps us understand how consumers describe their emotional experience with a product or brand, going deeper past sentiment.
Emotions detected by the AI do not need explicit mention of, for example, “joy” in a post. Rather, the pattern recognition of what words or phrases strung together that equal an emotion of “joy” are identified and we then understand that a consumer experiences love for the experience.
Current AI capability detects the emotions:
- Anger = When the person has negative experiences that cause a physical or psychological disturbance, he/she expresses ‘anger’. This expression includes irritations and annoyance along with verbal attacks.
- Disgust = When something is perceived as revolting, distasteful, and unpleasant, the person expresses ‘disgust’. It could be associated with concrete features such as appearance and taste as well as moral values and beliefs.
- Fear = When the person has an emotional response to an immediate threat. We can also develop a similar reaction to anticipated threats or even our thoughts about potential dangers, and this is what we generally think of as anxiety. Some people may be more sensitive to fear and certain situations or objects may be more likely to trigger this emotion, while others actually seek out fear-provoking situations.
- Sadness = When the person experiences an undesirable outcome or failure, he/she expresses ‘sadness’. This emotion is characterized by unhappiness, disappointment, and withdrawal.
- Surprise = When the person encounters something unexpected, he/she expresses ‘surprise’. Unforeseen and sudden experiences may lead to both positive and negative expressions of surprise.
- Joy = a general state of happiness. The person feels joy because of a positive experience with a certain object but does not necessarily direct the emotion toward it. The positive experience creates a rather general cheerful and amused state.
2. How to use Ekman Emotions?

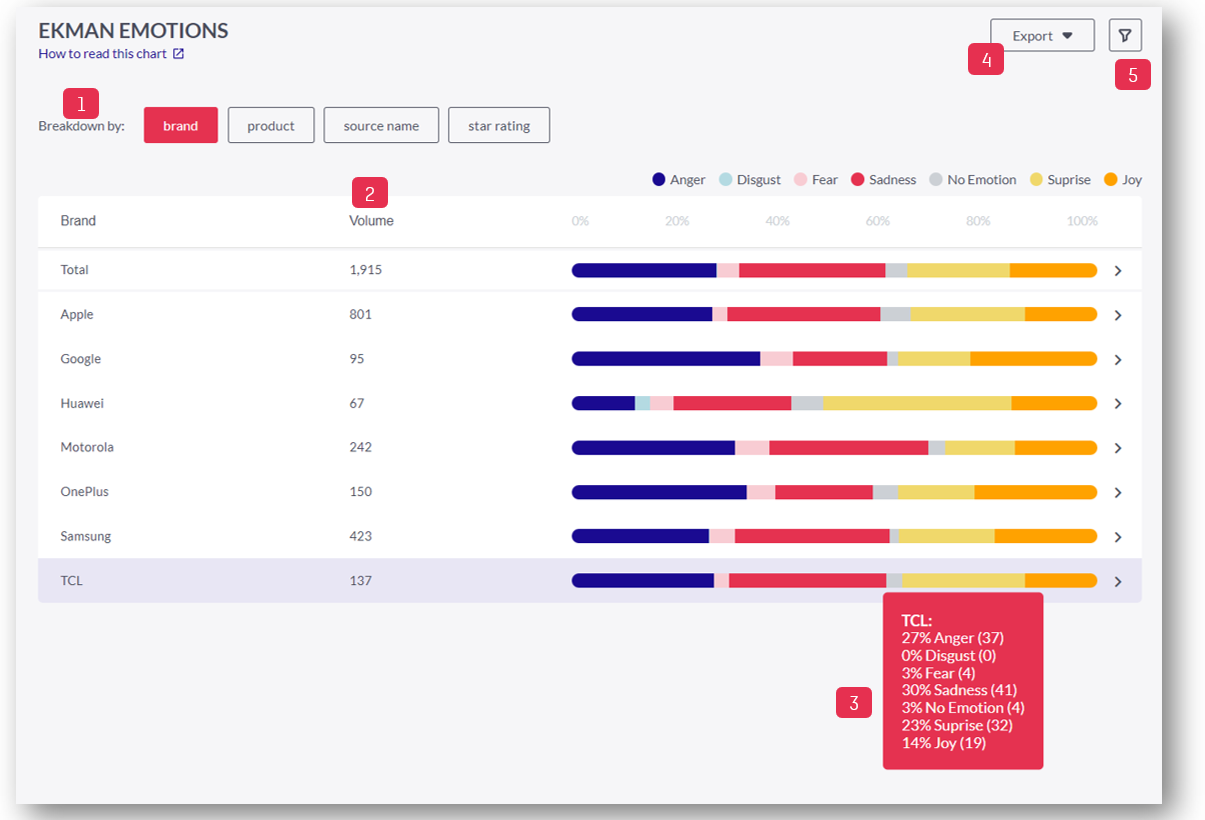
1. Apply the 'Breakdown by' depending on the meta values of your data (e.g. brand, product, source, etc.)
2. Volume shows the total number of posts assigned to the selected meta value.
3. The bar charts show the distribution of the different emotions in a 100% stacked chart style. When hovering over the bar charts, you will see a comparison of relative and absolute numbers.
4. Click here to export the data as CSV or PNG
5. Apply Slicing filter: You can slice by category, topic, personality (emotional/rational), psychographic segments, your own meta values, enter a date range or search for specific keywords.

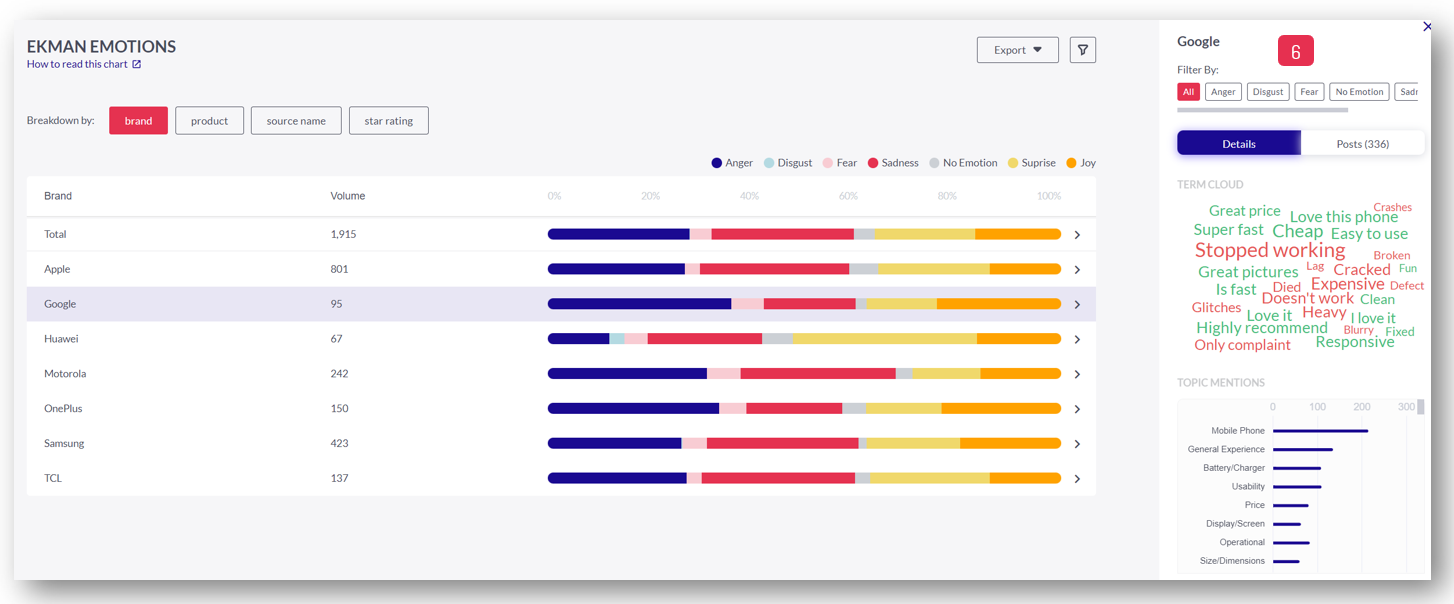
6. The sidebar contains a filter for all the emotions, which affects the underlying charts. The term cloud shows the phrases linked to the selected emotion while the topic mentions allow exploring the top-mentioned topics.