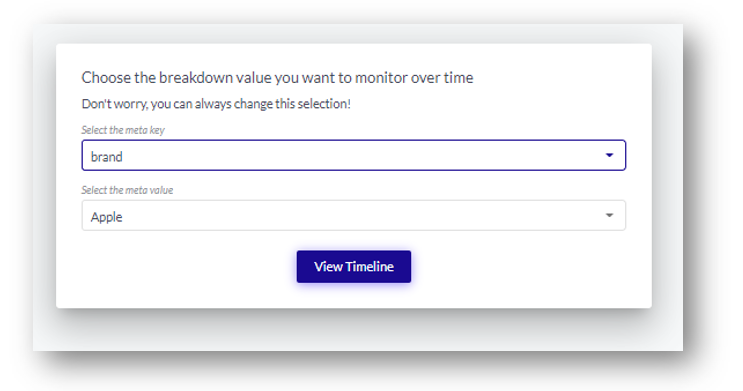
How to set up the chart?
- Select the breakdown option (meta key + meta value) you want to monitor the post volume and net sentiment development for
- Once you have selected the value, click "View Timeline"
How to read the chart?
Once you have selected a value to monitor over time, you will see a chart showing:
-
Red Line: The Net Sentiment development over time for the selected value
-
Blue Line: Industry Average Net Sentiment over time
-
Grey Line: Post Volume development over time
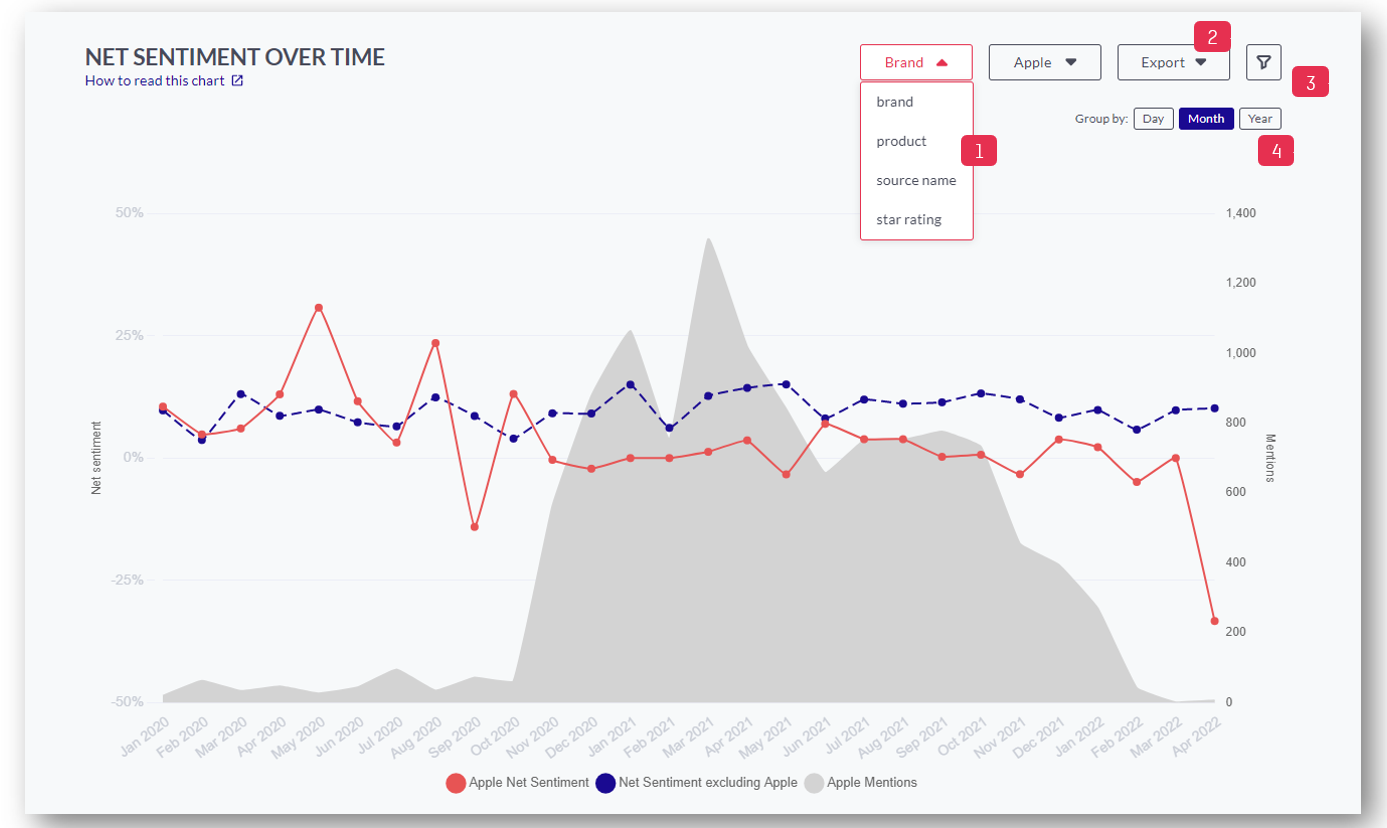
- Click here to change the value you want to monitor
- Click here to export the data as CSV or PNG
- Click here to apply different filters to your data. You can filter for a specific Category or Topic, Personality (emotional or rational posts), Sentiment, Recommendation (Promoter, Detractor, Indifferent), Psychographic Segment, your own meta fields (e.g. brand, product etc), enter a specific date range or search for keywords
- Click here to group data by day, month, or year
Net Sentiment = [(count of positive terms - count of negative terms)/ total count of terms] *100