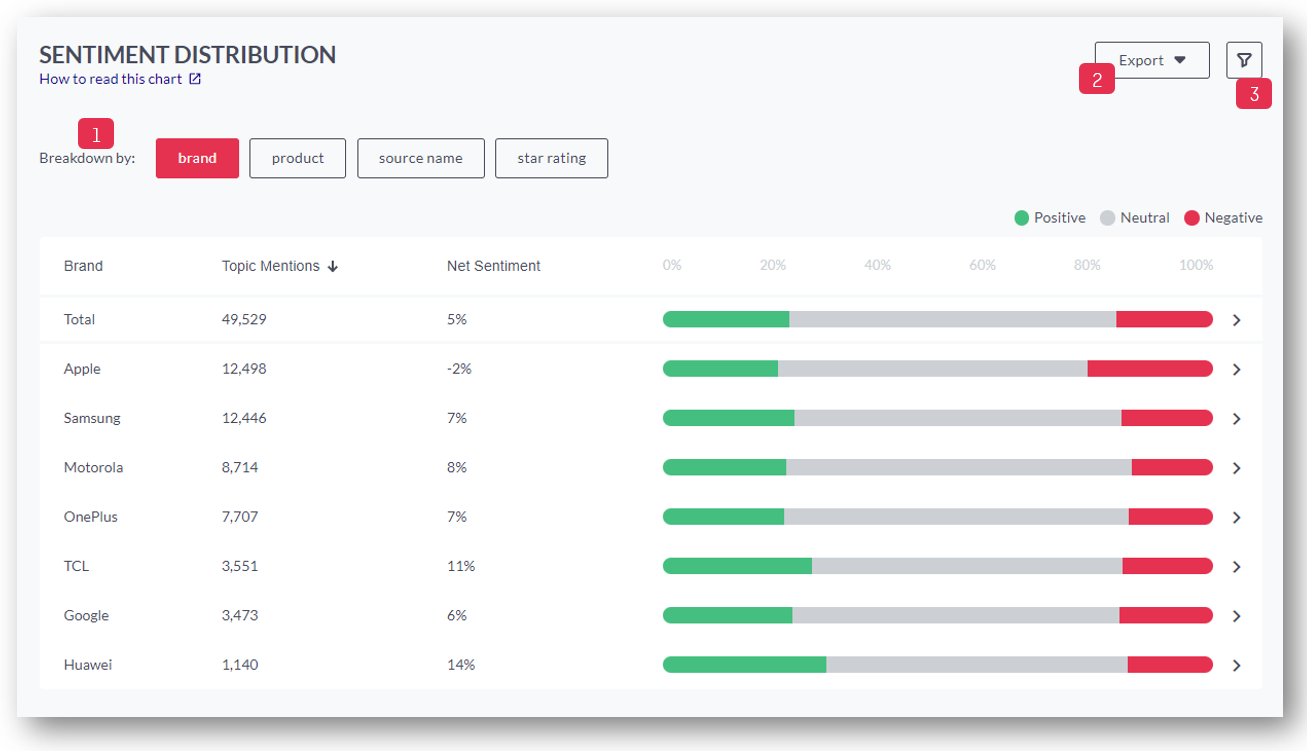
1. Click here to break down the chart based on the available meta values of your dataset. This allows you to compare the sentiment by brand and other meta fields
2. Click here to export the chart view as CSV or PNG
3.Apply Slicing filter: You can either slice it by category, personality (emotional/rational), recommendation (promoter, detractor, indifferent), your own meta fields, enter a date range, or search for keywords
4. The volume shown here = # of topic mentions
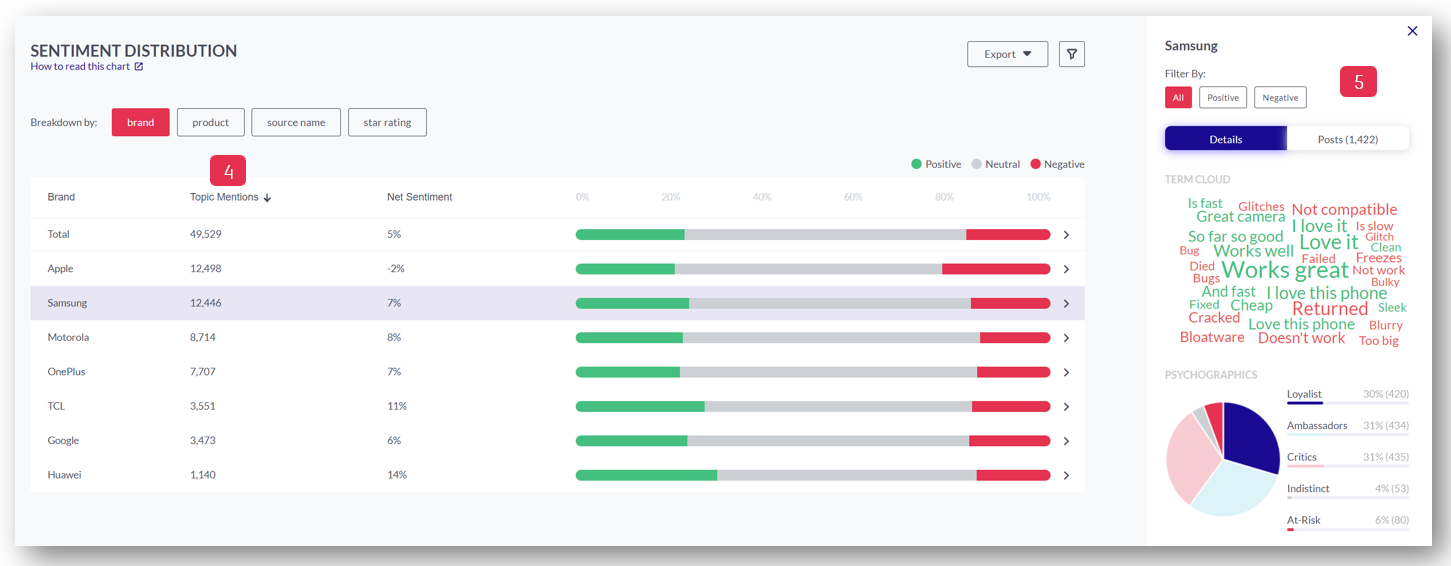
5. Click on a value in the bar chart to open the sidebar with more detailed information about the selected value:
- Details: Term Cloud with positive and negative terms and the psychographic segments
- Posts: view the original posts here
Whilst in the 'Sentiment Analysis - Overview' the sentiment is being shown on a post-level basis, here in the 'Sentiment Distribution' sentiment is being shown based on positive and negative Relex instances in your project