In 'Topics over Time' you can select the category of the topics that you want to see in the timeline chart: 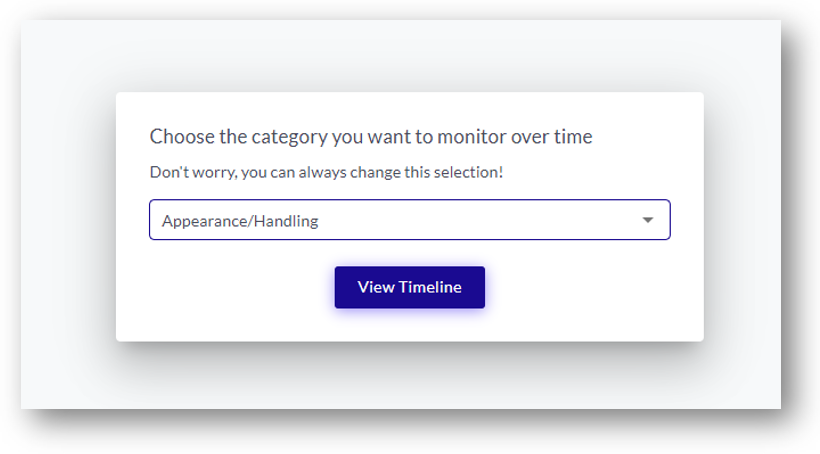 As soon as the category is selected, you will see a chart with the volume development of the topics belonging to this category:
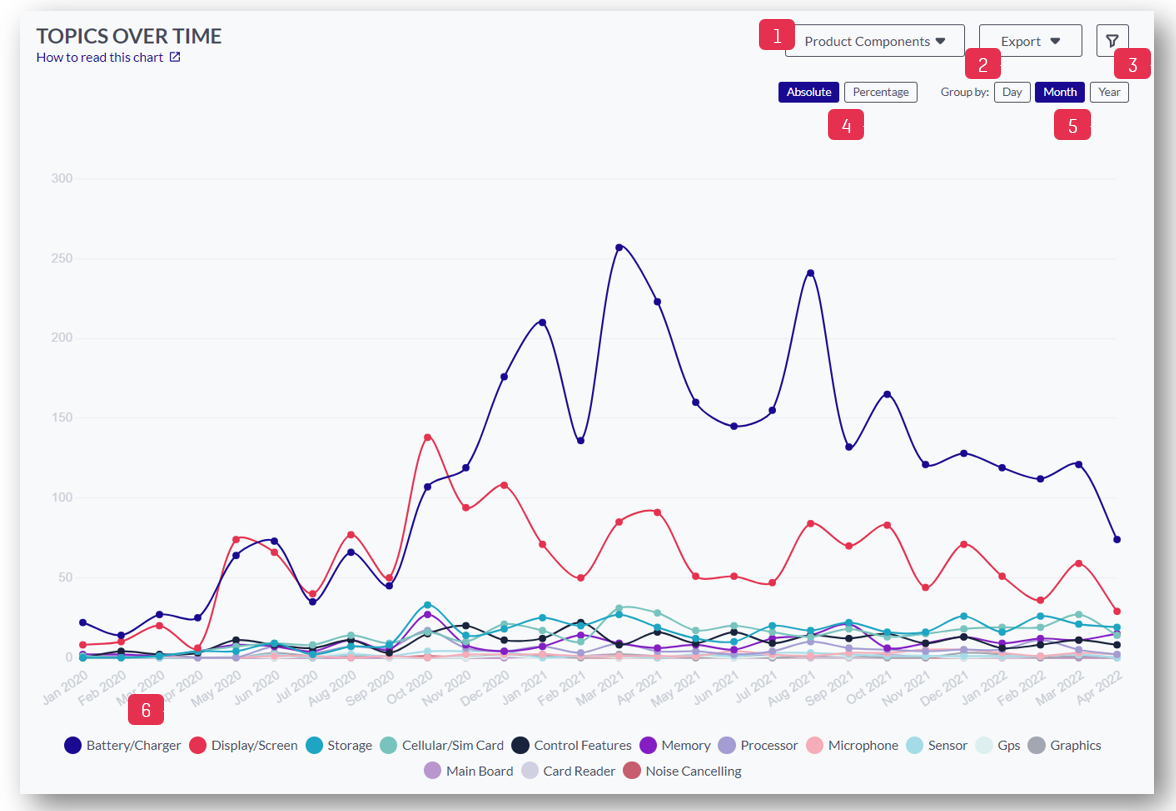
- Selected Category; you can switch between the categories available here
- Click here to export the data as CSV or PNG
- Click here to apply different filters to your data. You can filter Personality (emotional or rational posts), Sentiment, Recommendation (Promoter, Detractor, Indifferent), Psychographic Segments, your own meta fields (e.g. brand, product, etc), enter a specific date range, or search by keyword
- Topic volume can be shown in two ways
- Absolute value (number of mentions of the topic): this indicates the absolute importance of a specific topic over time
- Percentage value (percentage of the number of mentions of the topic over total mentions of all topics from the selected category): this indicates the relative importance of the topic within that category over time
- Click here to group data by day, month, or year
- Click on an individual topic to show/hide in the chart. By default, the chart shows up to 3 topics, and you can add as many topics as necessary
Tip: You can click on a specific data point in the chart to open a sidebar with the original mentions for the selected data point