
Find here an overview of the newest releases we shipped to the platform
👍New Features
- Split Option in 'Overview'
In 'Overview' you can now find a "Split by" option, which allows you to see how your meta data compares on different dimensions
- Select a "breakdown" option
- Click "Add split" and select "split by" option and add another breakdown filter
- You'll now see a bar chart that combines these two values to show its interrelation
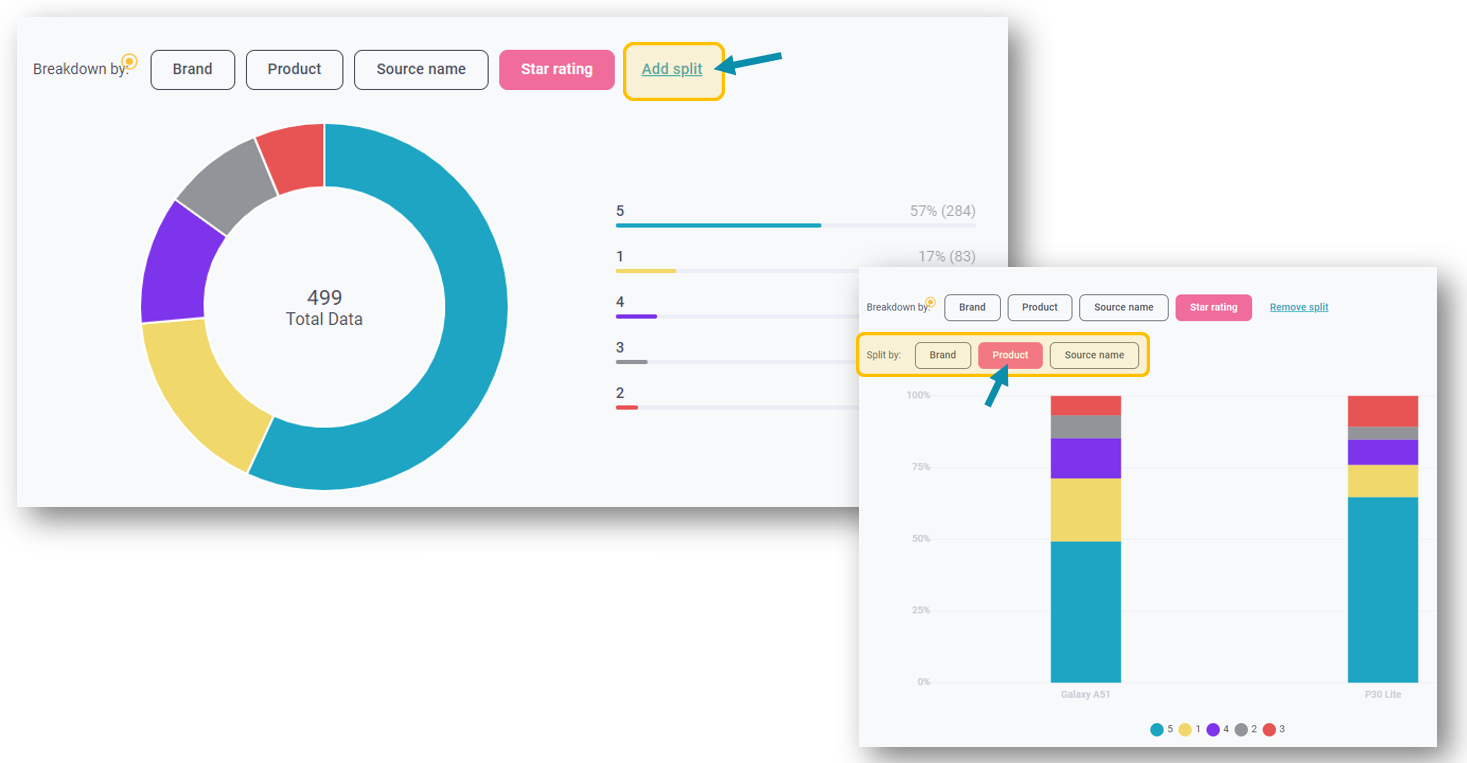
Example: Choose to breakdown the Donut Chart by Star Rating and then add a split for the Products to see how star ratings distribute between the products
- Net Sentiment Heatmap
The Sentiment Heatmap in 'Comparison' helps you easily compare the net sentiment of categories and topics across your metafields (brands or products etc)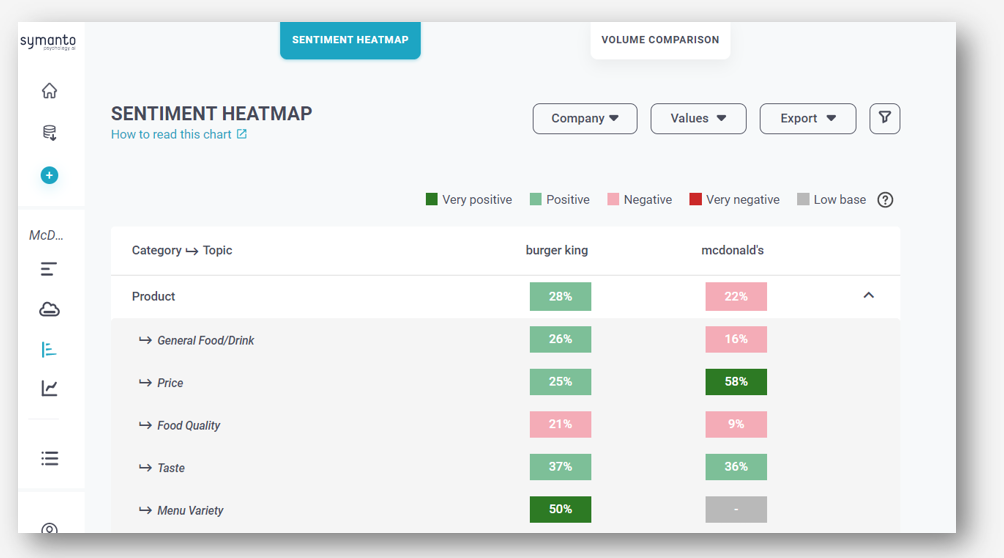
- Social Media Data Collection can now be requested through the Data Collection page
🚀Improvements
- Volume Comparison
In 'Comparison' the Volume Comparison chart has been updated to reflect insights of categories and topics in a more structured way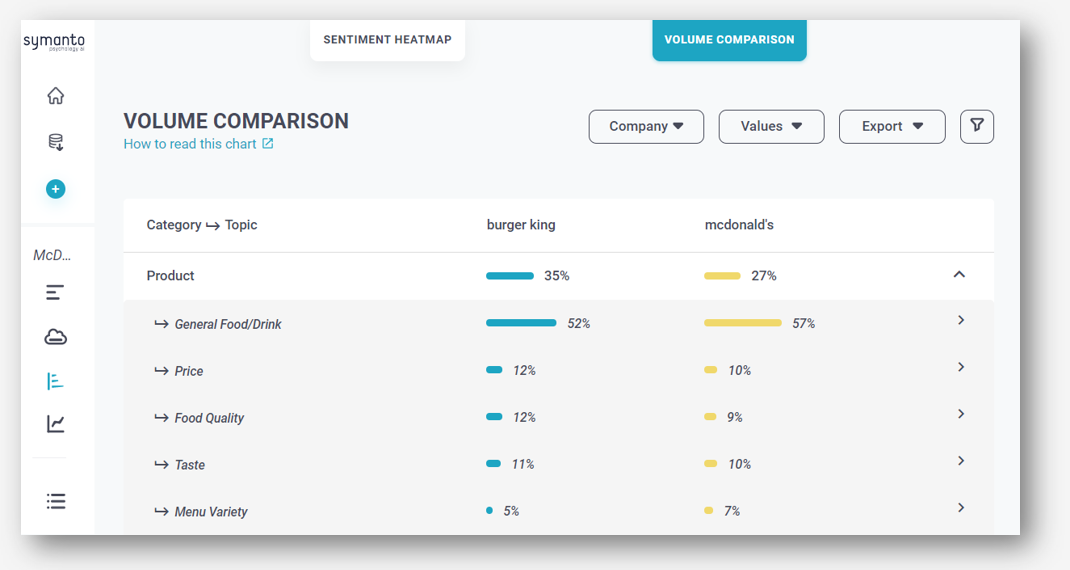
- We added absolute numbers to the tooltips on the Psychographics page
- When opening the side bar in the sentiment tab, you can now read through the original posts
✅Fixed Issues
- Fixed an issue where charts weren't visible if a project showed too many items in the chart's legend
- Show/Collapse icons have been turned 180° to comply with state-of-the-art UX practices
- Added missing “%” to the tooltip on volume/net sentiment chart and csv export