1. Breakdown by
1.1. Volume Comparison
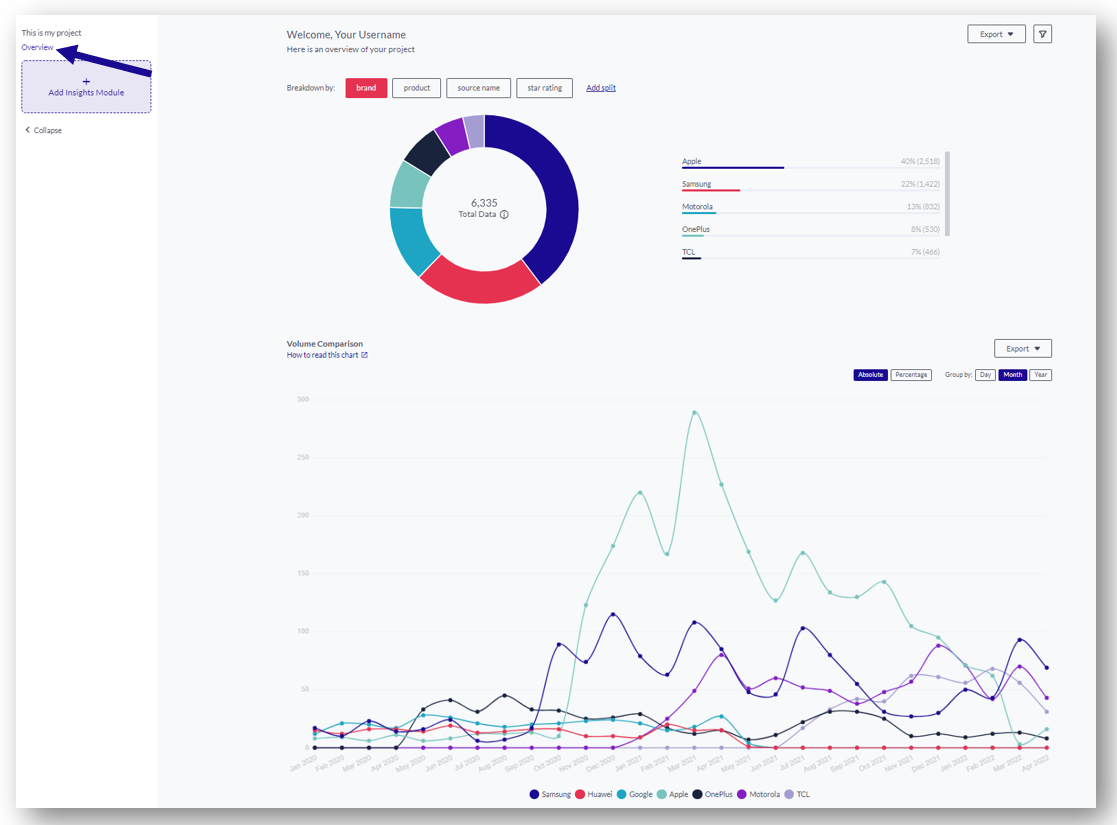
As soon as the analysis is complete, you will see an Overview of your project:
This will give you a first impression of your analysis, such as the total amount of data and a volume comparison. The charts can be broken down into different data splits depending on your meta information.
1. Breakdown by
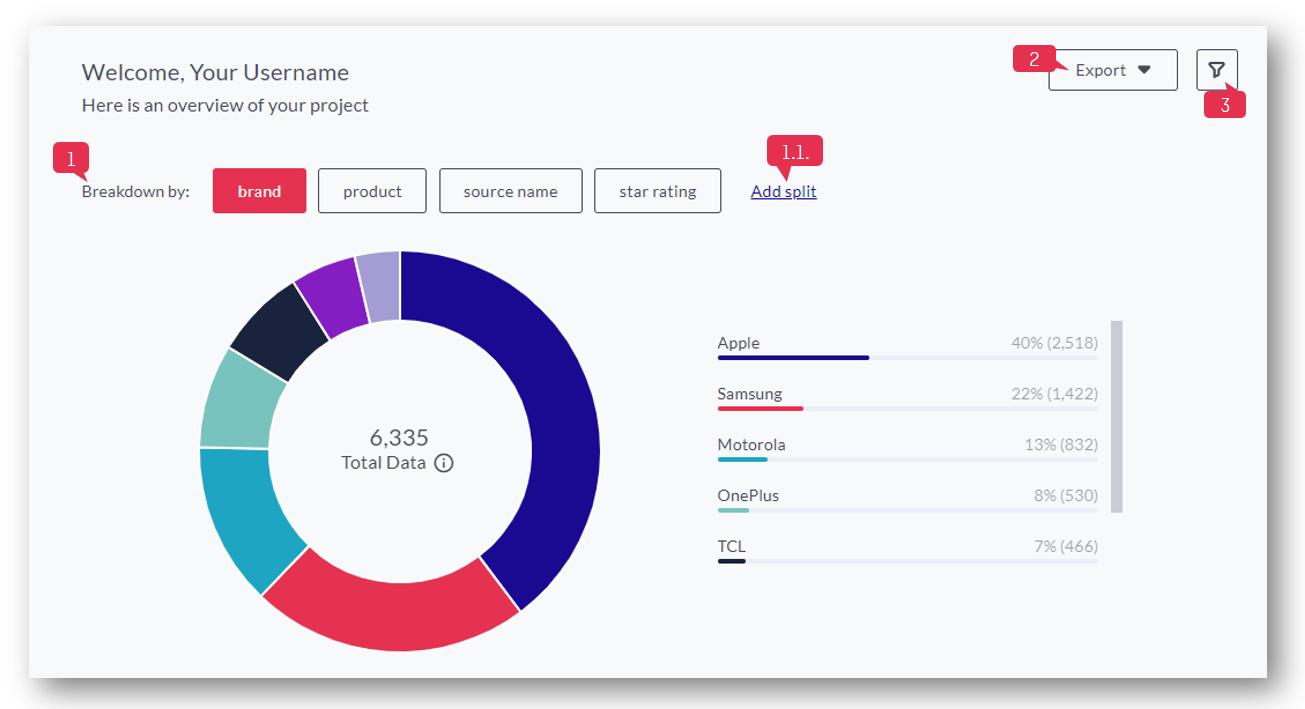
1. Click the different labels to break down your data by e.g. brand, product, rating, source, etc.
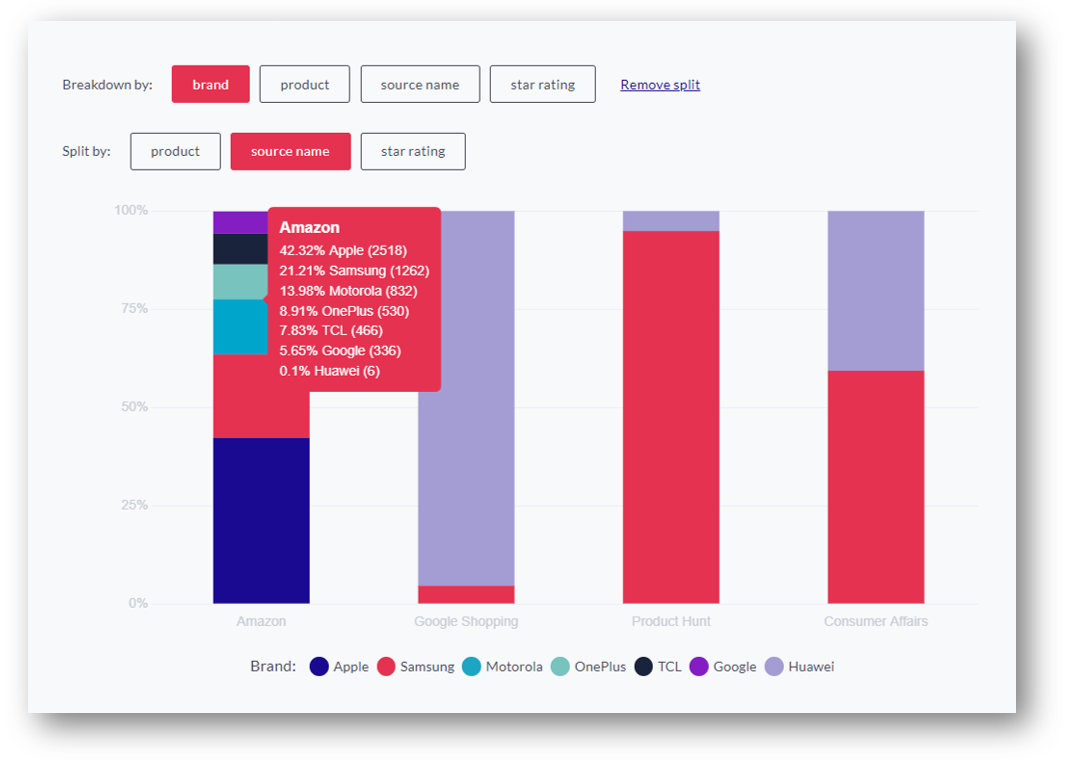
1.1. Click 'Add Split' to further breakdown your data according to your filter options
2. Click here to export the donut chart as CSV or PNG image
3. Apply different filters to your data. You can filter Category, Personality (emotional or rational posts), Recommendation (Promoter, Detractor, Indifferent), Psychographic Segments, your own meta fields (e.g. brand, product, etc), enter a date range, or search for a specific keyword
1.1. Volume Comparison
Based on the different meta fields of your data, you can monitor the development of your data. The chart is displayed depending on the 'Breakdown by' value you selected above.
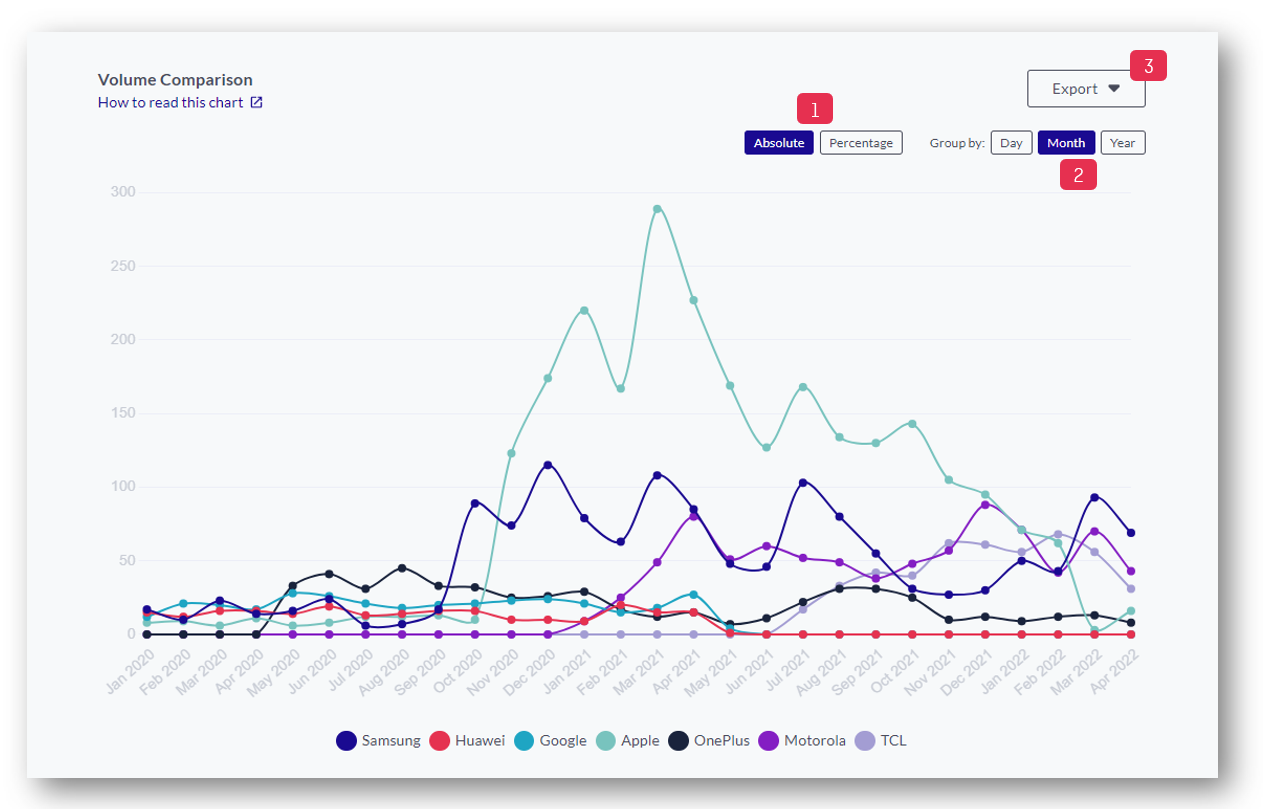
- Absolute value or percentage value
- Group data by day, month, or year
- Click here to export the data as CSV or PNG
In order to get more in-depth insights from your project, you can now activate modules and add these to your project. Click here to get to our article about the modules.