The 'Classification' will give you an overview of all the detected categories, the underlying topics, the number of texts containing this category and topic, the Net Sentiment, as well as the corresponding sentiment: the number of texts with the positive topic sentiment, number of texts with the negative topic sentiment, and number of texts with the neutral topic sentiment.
Net Sentiment = [(count of positive terms - count of negative terms)/ total count of terms] *100
If you want to read more about Net Sentiment please visit our FAQs page: What is Net Sentiment?
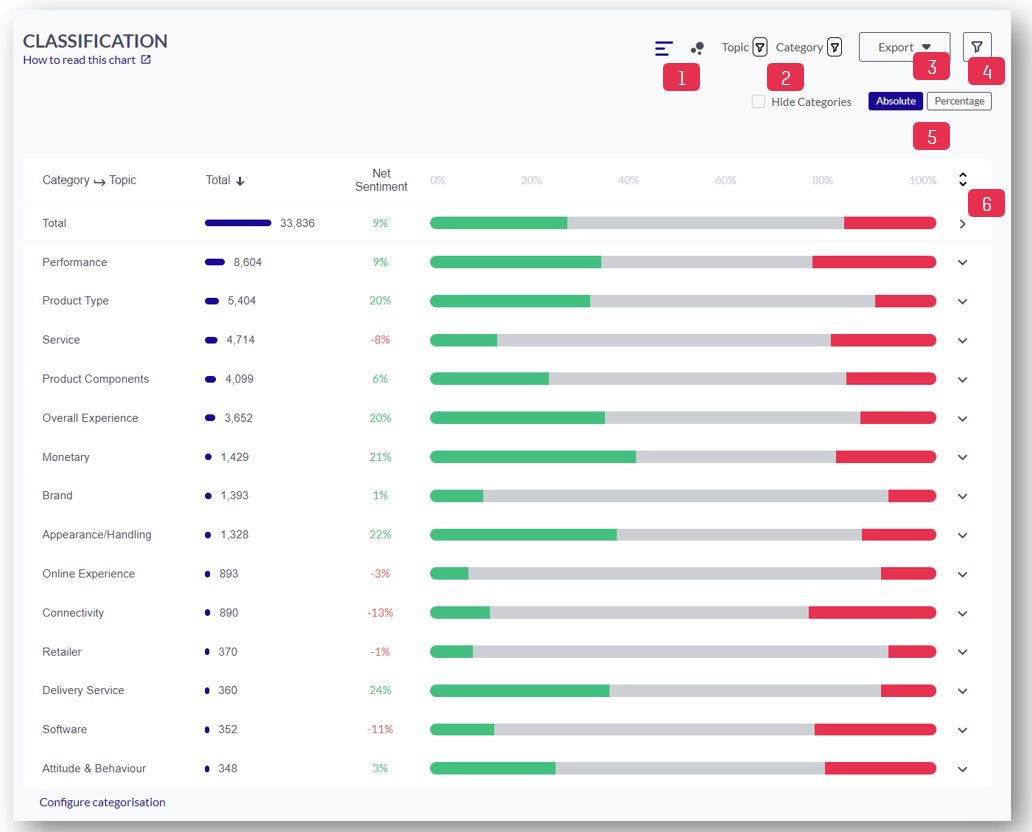
1. Click here to switch between the table view and the bubble chart visualisation. For more information about the bubble chart please jump here to our description below
2. Apply a filter for either Topic or Category
3. Click here to export the data as CSV or PNG
4. Click here to apply different filters to your data. You can filter for a specific Category or Topic, Personality (emotional or rational posts), Sentiment, Recommendation (Promoter, Detractor, Indifferent), Psychographic Segment, your own meta fields (e.g. brand, product, etc), enter a specific date range or search for keywords
5. Click here to switch between absolute and relative numbers
6. Click here to expand all or collapse all
Note: Click on a category to reveal its underlying topics and numbers.
You can also 'Hide Categories' to only show the Topic Level.
By default, the information is ranked in absolute numbers sorted by count. You can sort the insights ascending or descending by clicking on the table header of either the total, positive or negative numbers or Net Sentiment:
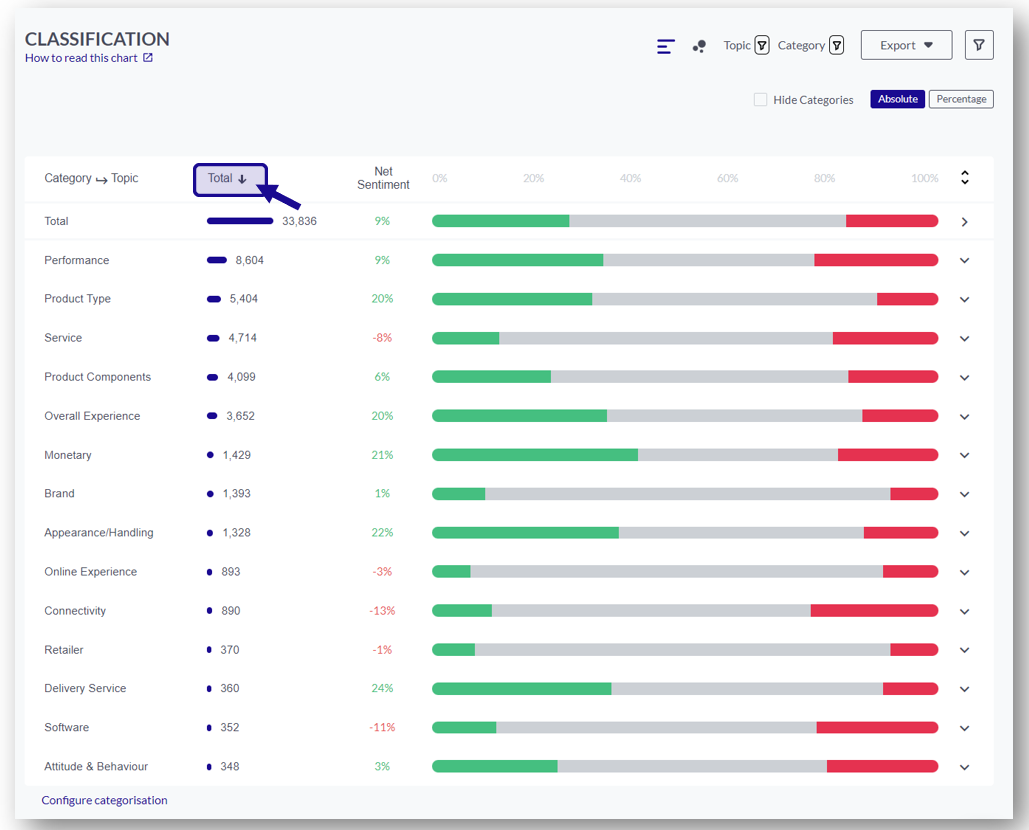
Further possibilities when exploring this page are:
1. Select a topic you want to investigate deeper. A new layer will appear on the right-hand side giving you more detailed information about the selected topic:
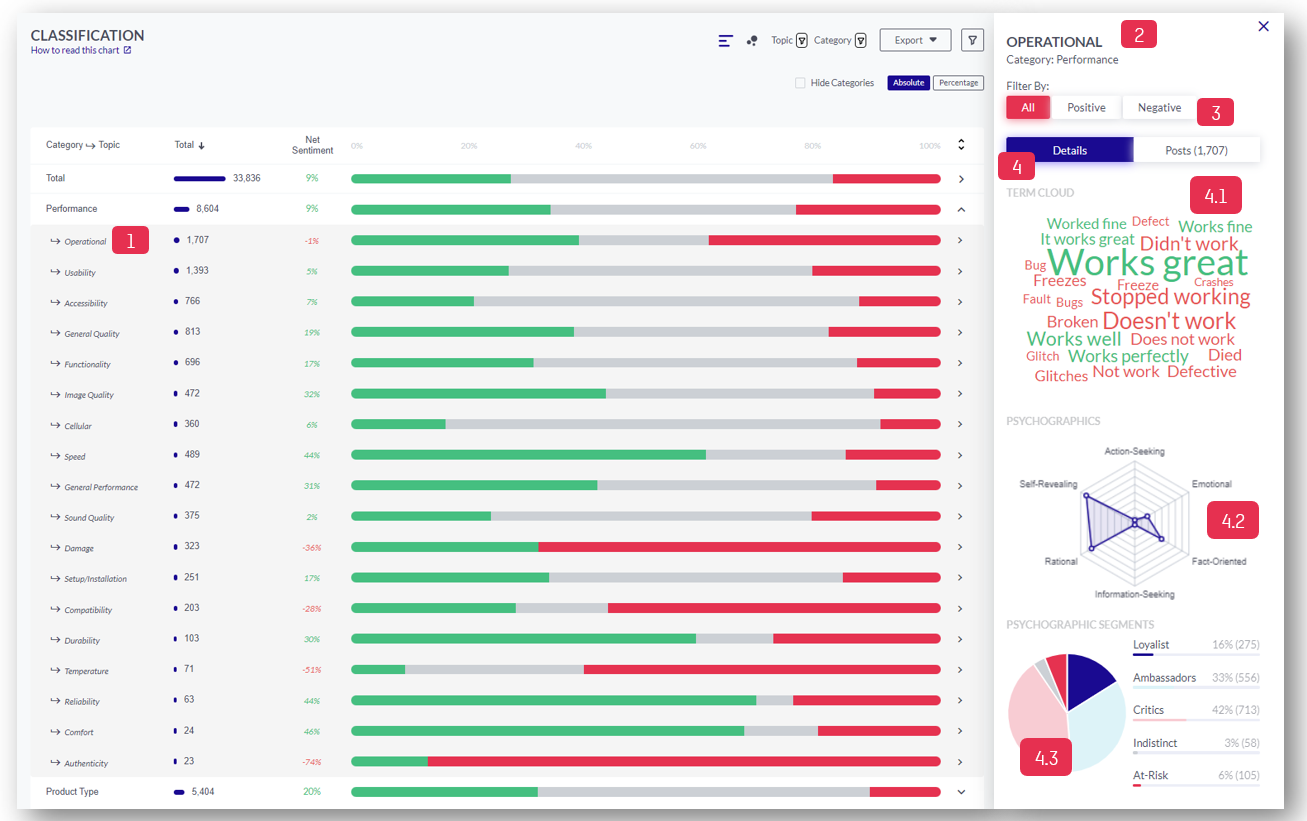
2. Here you can see the selected Topic and the corresponding Category
3. Here you can filter by Sentiment: All (to show the total), Positive or Negative
4. Here you can select between Details or Posts
4.1. Here you can see the Terms which have been detected within the selected Topic
4.2. Here you can see the different Psychographic Elements
4.3. Here you can see the Psychographics Segments
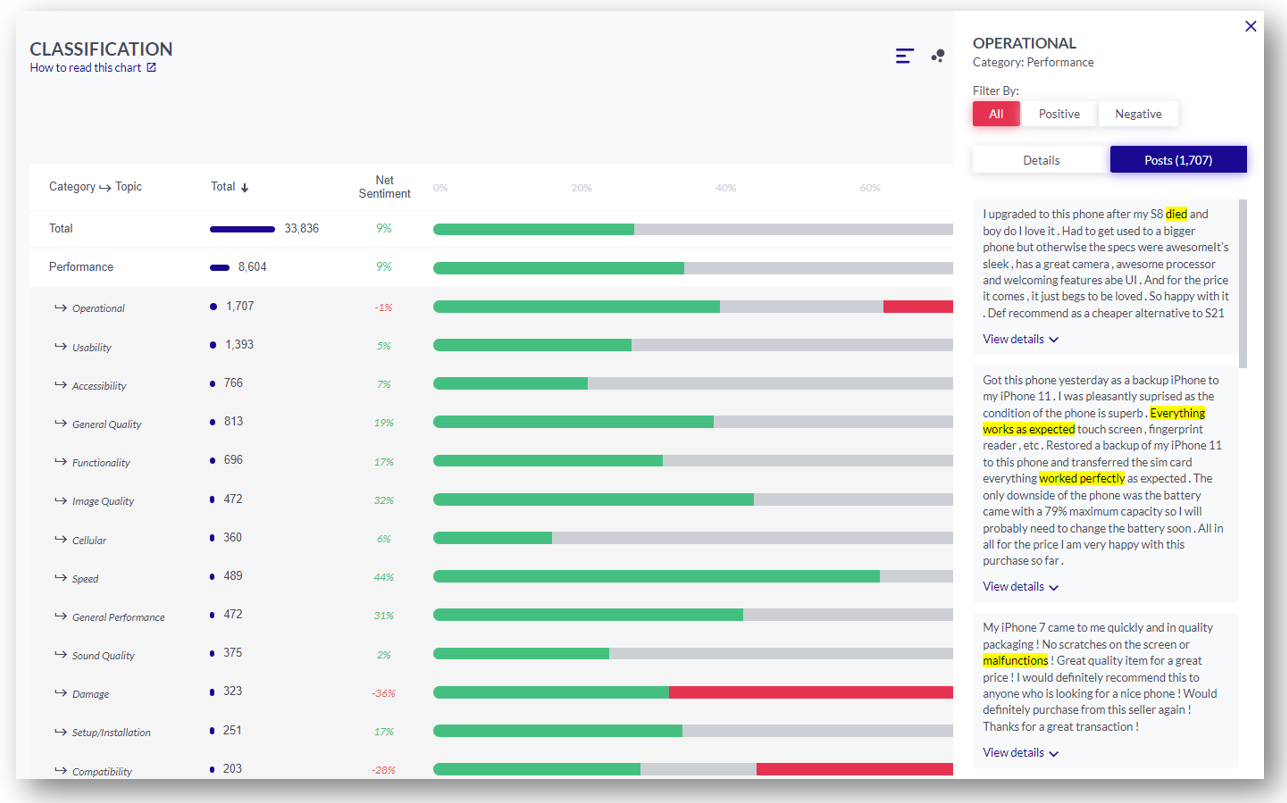
Note for 4.: When selecting Posts you will be able to see the original postings within your selected Topic.
Tip: You can apply a multi-select filter for categories and topics on the “topics by volume” chart

Topic-Volume Net Sentiment Visualisation (Bubble Chart)
In the Topic module you can switch between the table view and bubble chart visualisation:
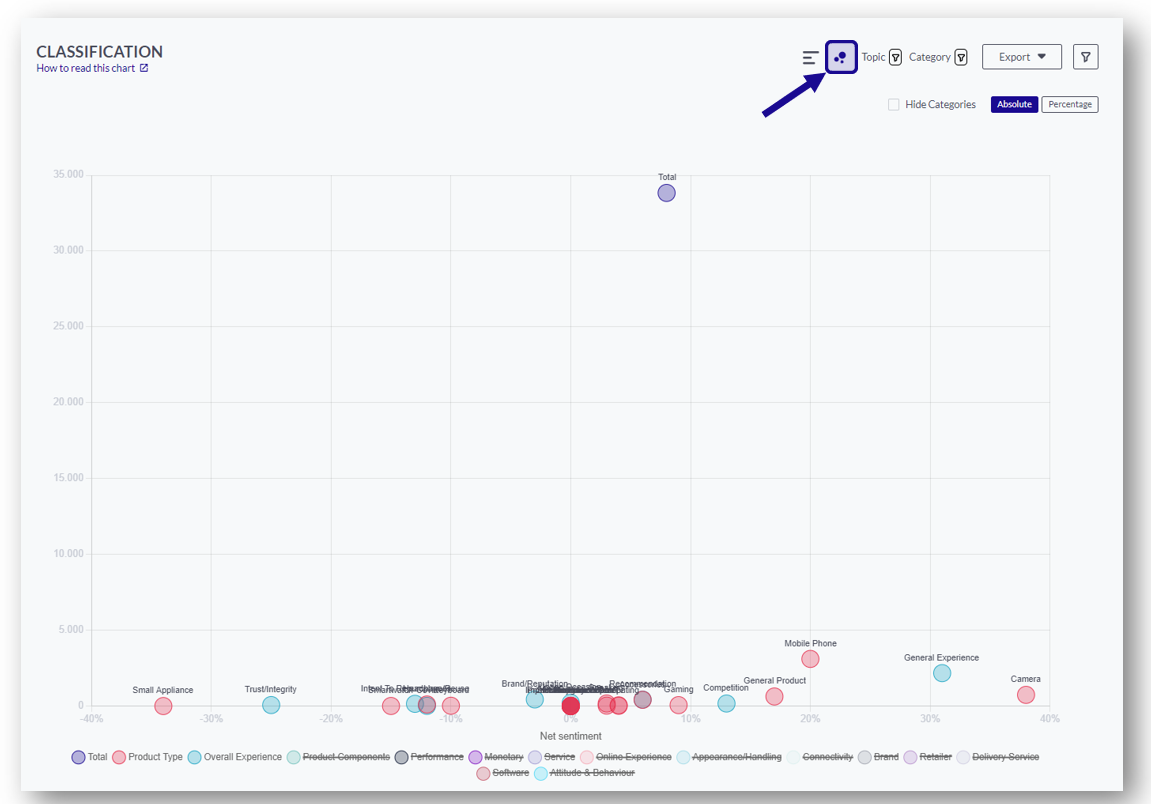
The bubble chart view is particularly useful to identify high impactful/critical topics easily:
It shows you the volume of a specific topic on the y-axis and the net sentiment in % on the x-axis. As an example, the further a topic is on the right and the further it is at the top, the more people talk about it positively.
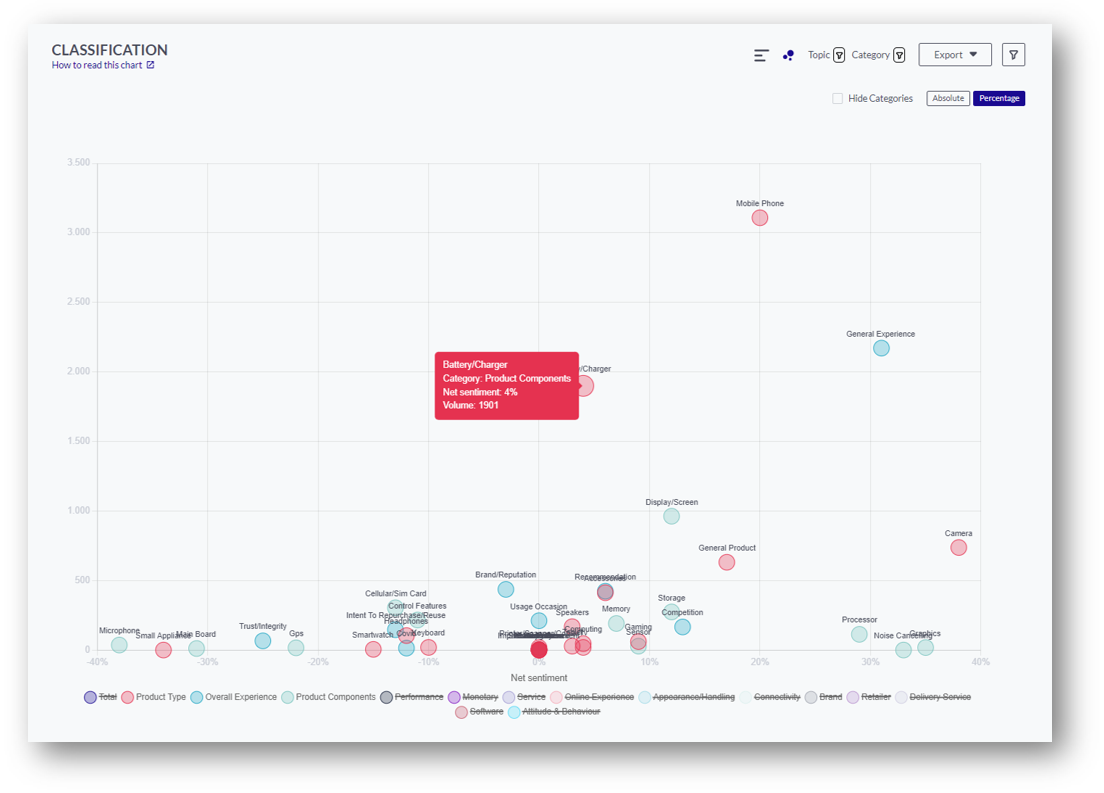
When hovering over the bubble of a specific topic you will get more details such as the category of this topic, the Net sentiment, and the volume (=number of mentions).
You can also select a topic to get more insights and a view of the posts:
Note: When switching back to the table-view of the Topic module the previous selection will be kept!