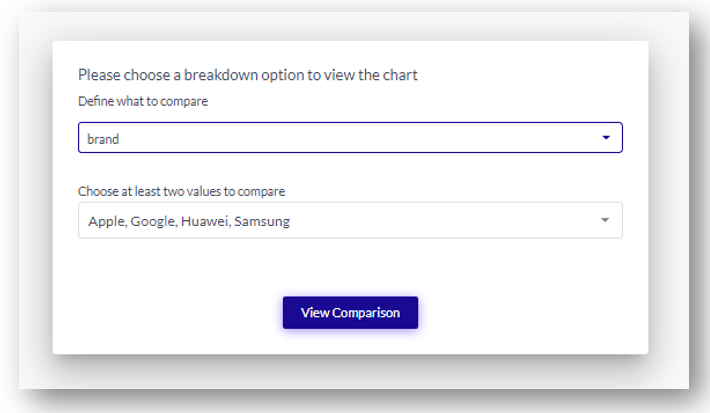
How to set up the chart?
- Select the breakdown option you want to compare, e.g. brand, product, etc.
- Select at least two values to define the subsets of data you want to compare against
- Once you have selected the values, click "View Comparison"
Now you can explore the categories and topics of your selected meta values and understand their difference in sentiment. Click any category to expand its underlying topics to dive deeper and achieve a more granular comparison
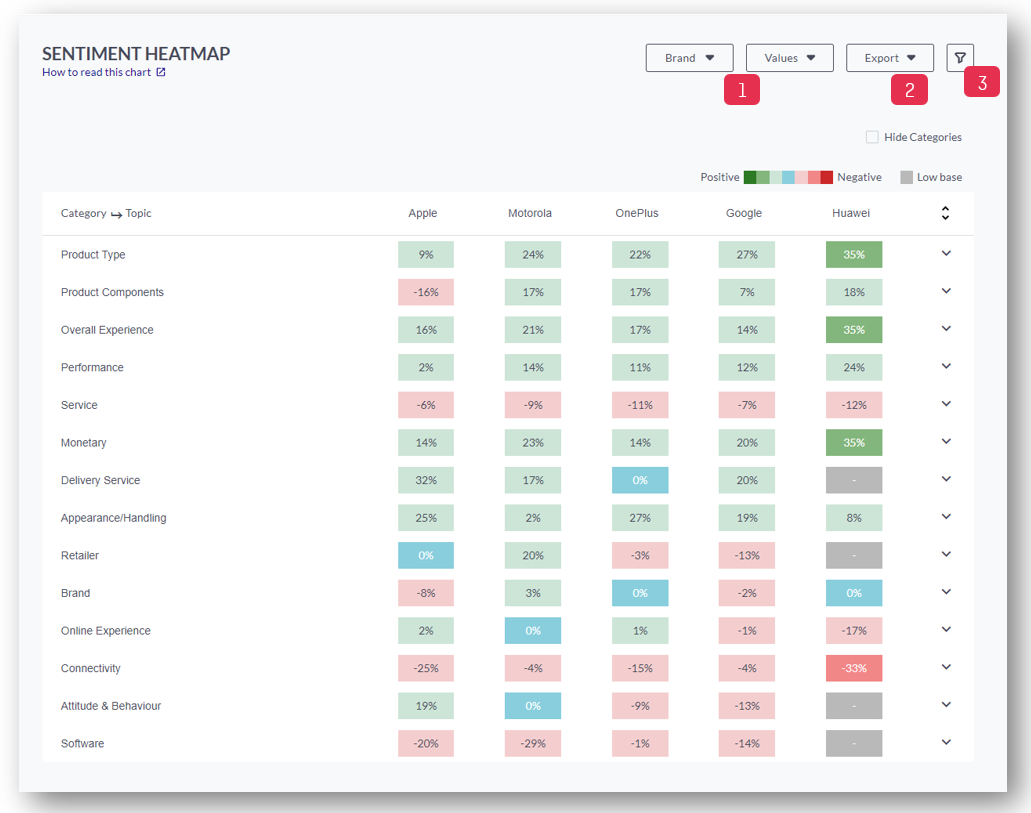
1. Click here to select a different meta field or different meta field values from the drop-downs
2. Click here to export the chart view as CSV or PNG
3. Apply Slicing filter: You can either slice it by category, personality (emotional/rational), recommendation (promoter, detractor, indifferent), your own meta fields, enter a date range, or search for keywords.
Tip: You can hover over the legend at the top to find out more about the color-coding of the net sentiment values.
If a category or topic is represented by less than 10 posts, it's considered as "Low Base" (grey).
Net Sentiment = [(count of positive terms - count of negative terms)/ total count of terms] *100
If you want to read more about Net Sentiment please visit our FAQs page: What is Net Sentiment?